PayWell
Salary and Benefits Survey
We are committed to provide you with a unique people analytics & benchmarking experience.
PayWell Salary and Benefits Survey
PayWell is a platform created to assist HR professionals and decision-makers to develop competitive HR policies that attract, motivate and retain talent & support the business strategy.
The 2025 edition gathered more than 149 participating companies from the following sectors: Banking, Pharmaceuticals, Retail, Industry, Technology, BPO/SSC.
Results are available on PwC’s interactive, user-friendly platform that includes not just extensive salary statistics but also insightful analytics, such as:
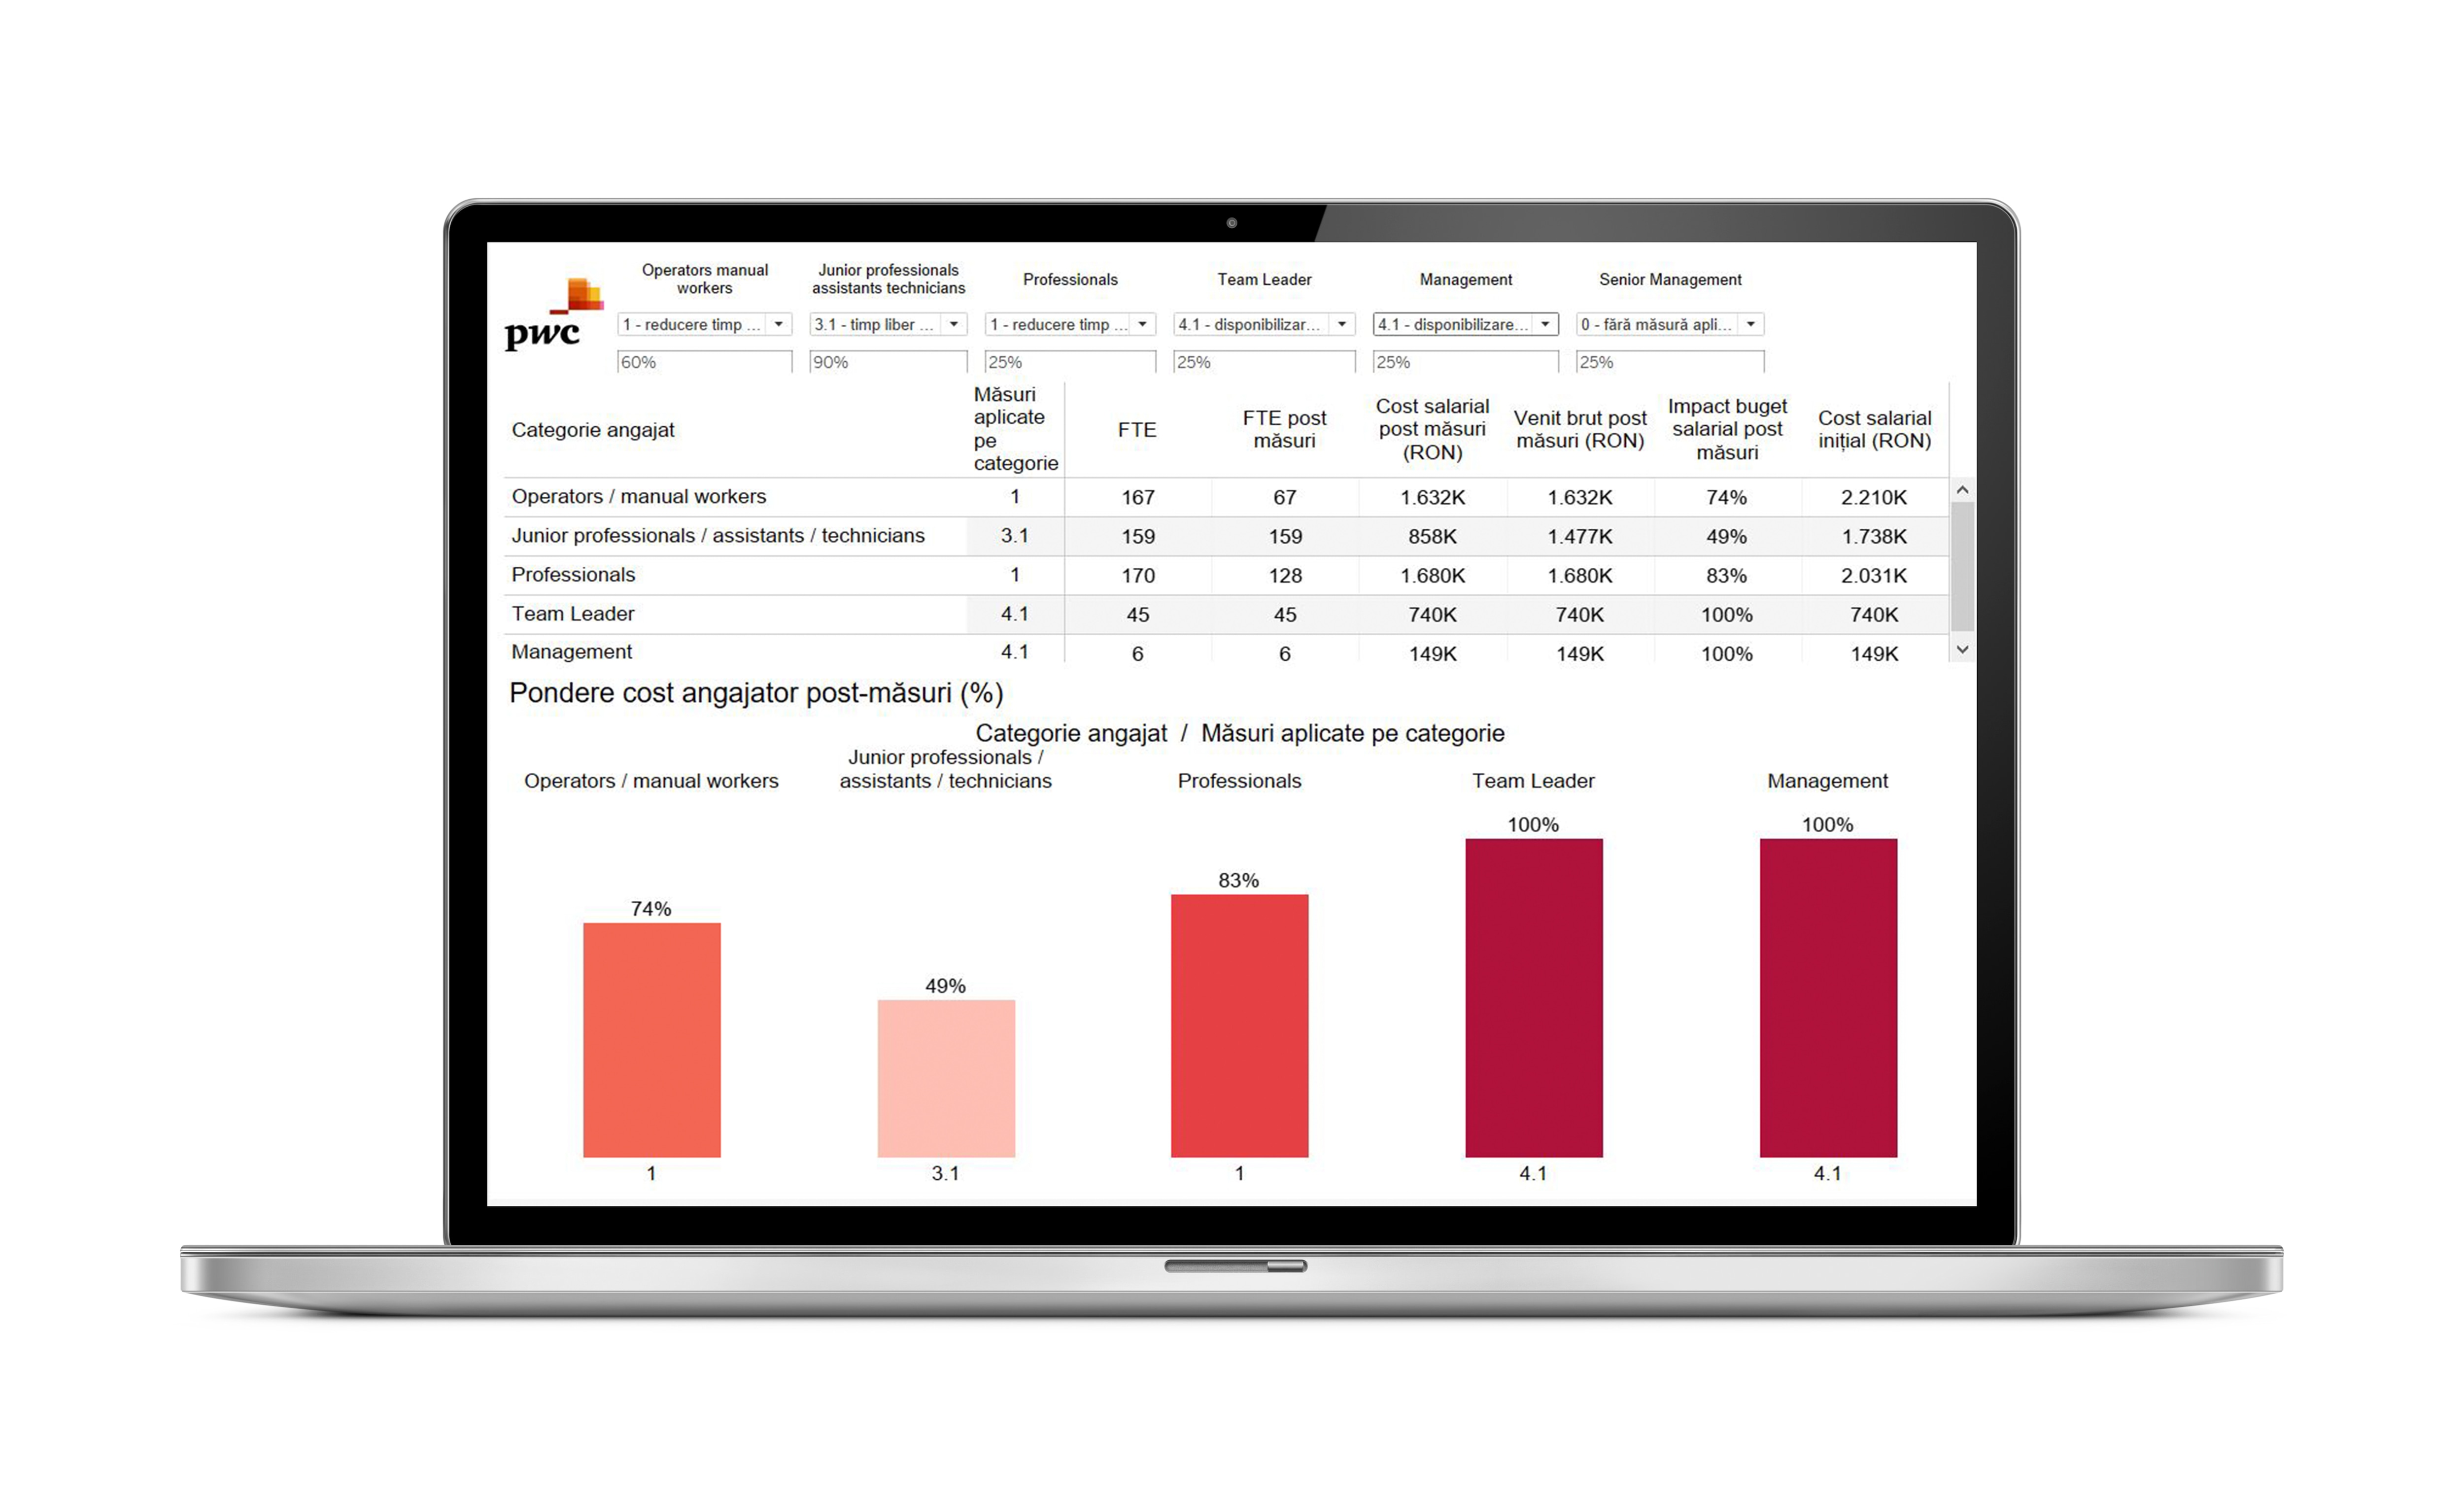
Intuitive PowerBI dashboards that allow customized data drill-downs, by sector, region, city or various demographics (gender, age, tenure, performance etc.) for unique positions or combination of positions
Salary trends for 3 years analyzed at overall or individual position level
Individual market positioning report
Qualitative reports on compensation and benefits practices, macro-economic and labour market indicators, executive summary ready to present to various stakeholders, quarterly HR Barometers
Annual report on gender pay gap (individual analysis and benchmarking)
Data collection & validation enhanced by technology
The insights available on the PayWell platform can equip your team with a valuable input and help you decide what are the best workforce strategies for your company. Find out more bellow.

Explore the key findings
Private sector gross wages increase
7.47%
increase in 2025
6%
increase expected in 2026
The organizational functions with the highest growth
Benefits
Top benefits that increased in 2025: discounts on company or partner products, office massage, therapy sessions, medical insurance.
Top benefits that decreased in 2025: eyewear reimbursement, entertainment, flexible benefits schemes, flexible time, medical subscriptions.
Medium and long-term challenges

The EU's Pay Transparency Directive requires HR to ensure compliance with new reporting requirements and accurate data management. Key challenges include reevaluating pay structures to ensure fairness, developing strategies to reduce gender pay gaps, and fostering a culture of transparency. Additionally, leveraging HR analytics and technology for ongoing monitoring, adapting to future regulatory changes, and implementing robust talent retention strategies are essential for long-term success.
Why PayWell
One of the best tools to analyze and understand reward data are Paywell dashboards. These are highly versatile and customizable, which makes them incredibly useful:
Trends Dashboard offers an overview into the evolution of salaries over the last 3 years.
Category Dashboard presents an insightful analysis of salary data depending on demographic variables such as Gender, Generation, Performance and Tenure.
Gender Pay Gap Dashboard calculates own metrics and allows benchmark analysis
Participants can access the Market Positioning Dashboard that explores in multiple graphic views your company's benchmark positioning.

Through its comprehensive reports and dashboards, which will help you aggregate information on multiple levels, together with an experienced account management team, Paywell 2024 is a powerful tool that will help you develop or adjust your Total Rewards strategy.
Contact us for the full report: |
ro_paywell@pwc.com |
Contact us


